
Nexa M1 — AI for the physical world.
A multimodal platform that ingests data from satellites, drones, cameras, sensors and weather stations, interprets the environment with AI, and delivers diagnosis, recommendation and an executive report in minutes.
- Satellites
- Weather
- Sensors
- AI
- Reports
- Alerts
- History
- Coverage
- 100% of the area
- Report
- In minutes
- History
- 12 months

Capture, processing, AI, diagnosis, recommendation and report.
- 01
Data capture
Satellites, drones, robots, RGB and multispectral cameras, IoT sensors, weather stations and smartphone photos feed the platform continuously.
- 02
Processing
Geometric and radiometric correction, mosaicking, georeferencing, per-field cropping, temporal normalization and spectral index calculation.
- 03
Artificial intelligence
Detection, segmentation and classification models plus language models interpret the scene, cross-reference historical and agronomic context, and quantify what was observed.
- 04
Diagnosis
The platform names the problem: water stress, nutrient deficiency, pest, disease, planting failure, degradation, thermal anomaly or operational deviation.
- 05
Recommendation
Each diagnosis becomes an action: a prescription map, visit priority, operational window, management adjustment or a command for an autonomous system.
- 06
Report
An executive PDF report with per-index maps, charts, class distribution, temporal evolution and a natural-language summary.
From sensor to decision, in a single pipeline.
Nexa M1 combines computer vision, language models, spatial reasoning and domain-specialized knowledge to understand operations in the physical world. Images, sensor series and business context go in; diagnosis, recommendation and report come out.
The same architecture that flags an anomaly in a field inspects an ore stockpile, tracks construction progress, or guides an autonomous robot. What changes is the context; the intelligence stays the same.

More sensors, more context.
The platform doesn't depend on a single source. It combines whatever is available in the operation and adjusts the diagnostic resolution to the data it receives.
Satellites
Multispectral imagery from public constellations with a revisit of a few days, and multi-year history per area.
Drones
High-resolution scheduled flights for detailed inspection, orthomosaics and plant-level reads.
RGB and multispectral cameras
Fixed and robot-mounted cameras, with visible, red-edge and near-infrared bands.
IoT sensors
Soil moisture, conductivity, level, vibration, consumption and machine telemetry, as continuous time series.
Weather stations
Local data from Atmos and public networks: temperature, rainfall, wind, radiation, humidity and pressure.
Smartphones
Field photos sent by the technical team, geotagged and analyzed through the same pipeline.
Video
Drone and robot inspection footage, with frame sampling, tracking and counting.
Enterprise systems
ERPs, farm management systems and operational databases integrated via API for business context.
What the platform can see, measure and predict.
Composable capabilities: a single analysis can detect a pest outbreak, quantify the affected area, compare it with the previous week and project the productivity impact.
- Disease and pest detection
- Vegetation indices
- RGB analysis
- Thermal analysis
- Hotspots and anomalies
- Temporal comparison
- Segmentation
- Classification
- Counting
- Yield estimation
- Automatic reports
- Data fusion
Disease and pest detection
Identification of foliar symptoms, infestation hotspots and spatial progression, with a confidence level per detection.
Vegetation indices
NDVI, NDRE, GNDVI, SAVI, EVI, NDMI, NDWI and NBR for vigor, chlorophyll, moisture, water and degraded areas.
RGB analysis
Color, texture and shape reading for planting gaps, weeds, soil cover and application quality.
Thermal analysis
Surface temperature maps for water stress, animal thermal comfort and equipment overheating.
Hotspots and anomalies
Automatic location of critical zones within the area, ranked by severity and extent.
Temporal comparison
Historical series per field, comparisons across dates, seasons and similar areas, with change detection.
Segmentation
Pixel-level delimitation of fields, water bodies, roads, stockpiles, structures, animals and machinery.
Classification
Crop typing, phenological stage, land use, surface type and infrastructure condition.
Counting
Counting of plants, gaps, animals, vehicles, pallets and assets, with tracking across video frames.
Yield estimation
Models that combine spectral indices, climate and history to project yield and internal variability.
Automatic reports
Full technical and executive reports generated without manual drafting, on demand or on a schedule.
Data fusion
Imagery, sensor, climate and history combined into a single contextual diagnosis instead of isolated readings.
Six modular layers, integrable via API.
Each layer evolves independently: new sensors, new models and new sectors are added without rewriting the platform.
- 01
Ingestion layer
Connectors for satellite, drone, camera, IoT, weather and external systems. Async queue, payload validation and versioning of every capture.
- 02
Geospatial processing layer
Reprojection, geometry-based cropping, mosaicking, cloud masking, index calculation and zonal statistics per area of interest.
- 03
Model layer
Detection, segmentation, classification and regression served via API, with domain-based routing and execution in the cloud or at the edge.
- 04
Reasoning layer
Language models with a sector-specialized SLM architecture translate numbers into diagnosis, probable cause and recommendation.
- 05
Data layer
Geospatial and time-series database with complete history per area, with access control by organization and user.
- 06
Delivery layer
Dashboard, interactive maps, alerts, export, PDF reports and a public API for integration with client systems.
A complete operating environment.
Dashboard
Consolidated view of monitored areas, indicators, latest analyses and open operational items.
Interactive maps
Polygon drawing, location search, per-index layers and pixel-level reading of the area.
History
Every analysis archived by area and date, with a full report download for each run.
Alerts
Email notifications when an index crosses a threshold, an anomaly appears, or weather changes the operational window.
Export
Executive PDF, georeferenced images, CSV series and layers for use in GIS.
API
Endpoints to trigger analyses, query results and integrate the platform with the client's system.
Multi-user
Organizations, teams and role-based permissions, with shared areas and access trails.
Data governance
Per-organization isolation, row-level access control and audit logging of operations.
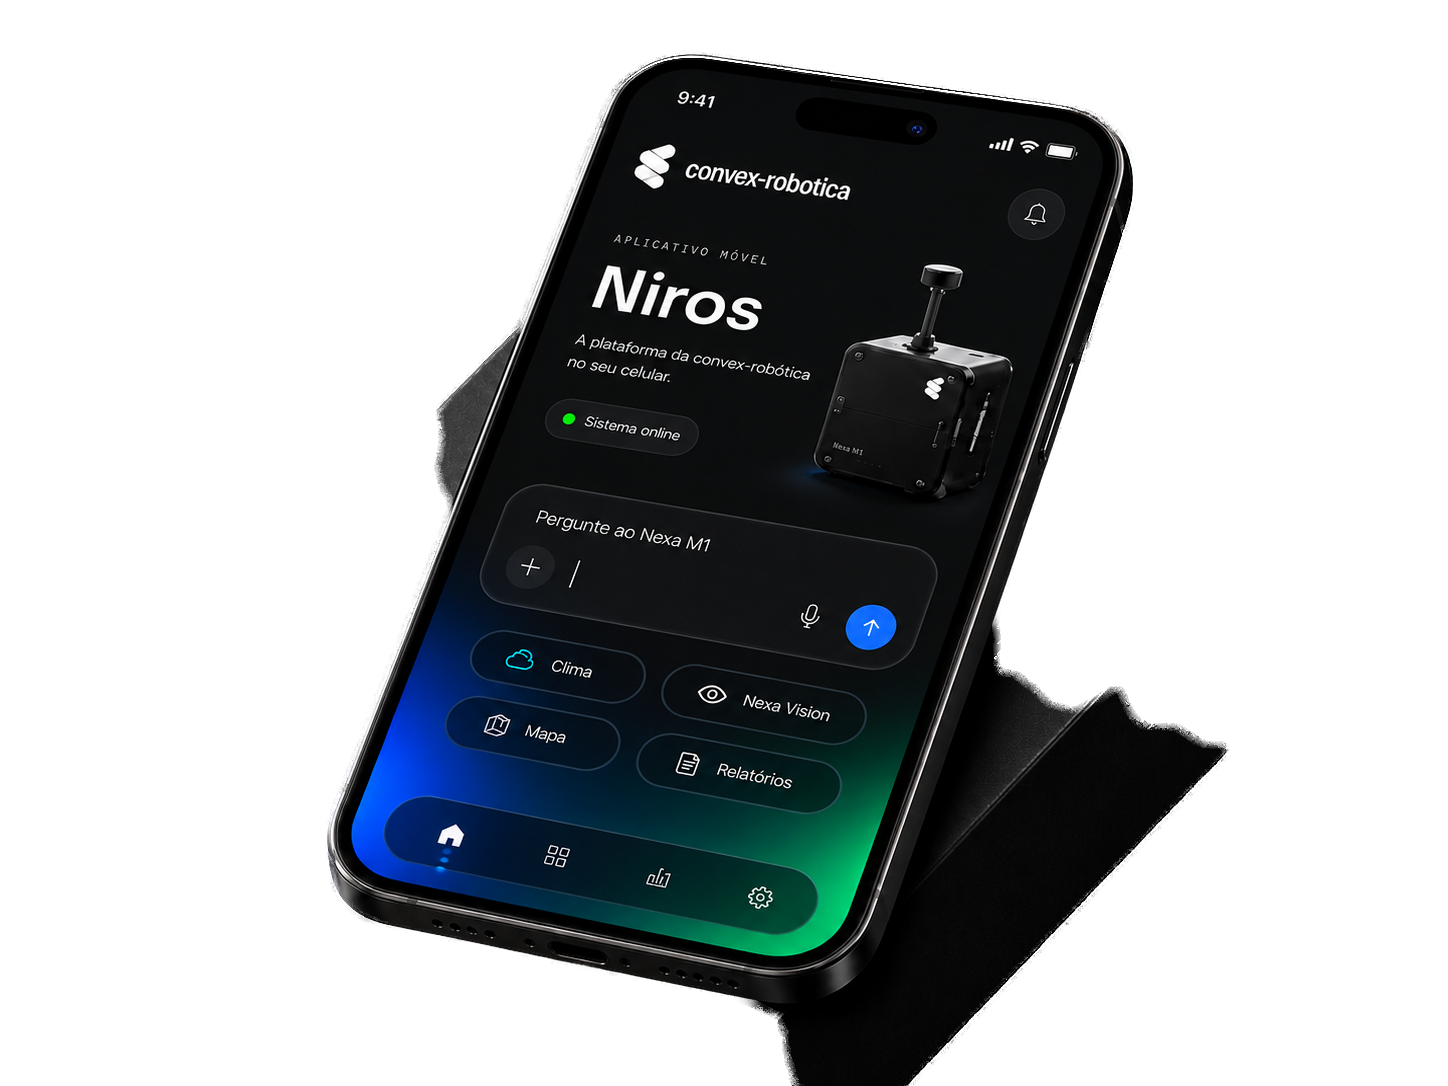
Nexa M1 goes with you into the field.
Areas, alerts, weather, reports and history are available in the Convex mobile app, with the same data as the web platform.
- Areas
- Monitored areas and the status of every analysis in your hand.
- Alerts
- Anomaly warnings, index thresholds and operational window changes.
- Weather
- Field conditions, forecast and agrometeorological indicators.
- Reports
- Maps, indices and PDFs available in the browser and in the app.
Less uncertainty, more operational control.
The platform turns physical-world data into actionable information, reducing reliance on manual interpretation and shortening the cycle from observation to decision.
Unified view
Satellites, drones, cameras, sensors and interactive maps feed a single panel, without information silos.
Early detection
Anomalies are identified before they become visible problems, widening the window for action.
Scale and standardization
The same analysis criteria apply to one area or thousands of hectares, without depending on the field team.
Automated decisions
Diagnosis, probable cause and recommendation are generated automatically, cutting the time between collection and action.
Instant reports
Technical and executive reports ready in minutes, with maps, charts and a natural-language summary.
Operational memory
Complete history per area, comparable across seasons, dates and units, for continuous management improvement.
Every analysis becomes a complete technical document.
Individual per-layer maps, distribution charts, temporal evolution and a natural-language summary, ready for the technical team and for leadership.
- RGB map
- NDVI map
- Hotspots
- Water stress
- Severity
- Executive PDF

RGB map
True-color image of the area on the analysis date, the visual base for every other layer.

NDVI map
Vegetative vigor classified into ranges, with the percentage of area in each class.

Hotspots
Critical zones highlighted and ranked by severity, ready to route the field visit.

Water stress
Moisture and surface water layers for irrigation, traffic and operational windows.

Severity
Intensity map of the detected problem, with affected area and progression between dates.

Executive PDF
A minimalist document with branded cover, essential indicators and a to-the-point summary.
One platform, six operational contexts.
Agriculture
Full-cycle monitoring: vigor, water stress, nutrition, weeds, planting gaps and yield variability, with prescription maps for site-specific application.
Livestock
Animal counting, weight estimation, behavior, thermal comfort, pasture assessment and water resource monitoring.
Forestry
Forest inventory, biomass estimation, detection of gaps, stress and burned areas, with multi-year stand tracking.
Mining
Stockpile volume estimation, tailings and slope monitoring, conveyor inspection and operational risk detection.
Construction
Progress compared against schedule, structural inspection, earthworks control and material and traffic management.
Robotics
Perception and context for aerial and ground robots: obstacles, trajectory, task prioritization and diagnosis-guided action.
Traditional method vs. Nexa M1.
| Criterion | Traditional method | Nexa M1 |
|---|---|---|
| Area coverage | Point sampling on foot | 100% of the area, pixel by pixel, on every revisit |
| Frequency | Sporadic visits, dependent on staff | Continuous monitoring and scheduled automatic analyses |
| Time to diagnosis | Days between collection and report | Minutes between capture and a finished report |
| Early detection | Problem already visible to the naked eye | Spectral and thermal signals before the symptom appears |
| Standardization | Depends on the evaluator's experience | Same criteria, same metrics, across the whole operation |
| History | Notebooks, spreadsheets and scattered notes | Complete time series per area, comparable across seasons |
| Recommendation | Manual interpretation by a technician | Automatic recommendation with probable cause and priority |
| Scale | Limited by team size | Thousands of hectares and multiple units in parallel |
Common questions about the platform.
Do I need a drone or robot to use Nexa M1?+
No. The platform runs on satellite imagery and climate data alone, and gains resolution as drones, cameras and sensors are added.
How long until I get the first report?+
After drawing the area on the map, the analysis runs and the full PDF report is ready in a few minutes, with every layer and chart.
Which crops and environments are supported?+
The platform is crop- and sector-agnostic: the spectral indices and vision models apply to fields, pastures, forests, mines, construction sites and industrial assets.
Is data isolated per client?+
Yes. Each organization has its own data, areas and reports, with role-based access control and an audit trail.
Can it integrate with the systems we already use?+
Yes. The platform exposes an API to trigger analyses and query results, and exports layers and series for use in GIS and management systems.
Does Nexa M1 work without internet in the field?+
Critical inference can run at the edge, embedded in the drone or robot, and results sync with the platform once the connection returns.
How does weather factor into the analysis?+
Data from Atmos and weather networks is cross-referenced with imagery to explain variations, predict risk and flag operational windows.
Is there a limit on monitored area?+
The plan defines the contracted area in hectares. The architecture processes multiple units and thousands of hectares in parallel.
Technical answers
Indices, probable causes and thresholds explained in plain language.
Operational context
Answers account for area, crop, weather and operational history.
Decision support
Action priority, operational window and the suggested next step.
Ask Nexa M1.
Convex's contextual assistant. Technical responses focused on robotics, drones, agriculture and regulation. For real operations, get in touch with us.
See Nexa M1 running on your operation.
Pick a real area, draw the polygon, and get the first complete report with maps, indices, diagnosis and recommendation.
Nexa Vision
Our AI for image-based analysis, diagnosis, recommendation and reporting.
Niros
Follow areas, maps, weather, reports, alerts, Nexa Vision and Nexa M1 from your phone.
Synapse Control
Our ground control station for planning drone and autonomous robot missions.
Axis
Our robot for process automation in agriculture and livestock.
Atmos
Our portable weather station, connected to Nexa M1 over the internet.