Observe
Nexa Vision
Visual and geospatial capture of areas of interest, clipped per polygon.
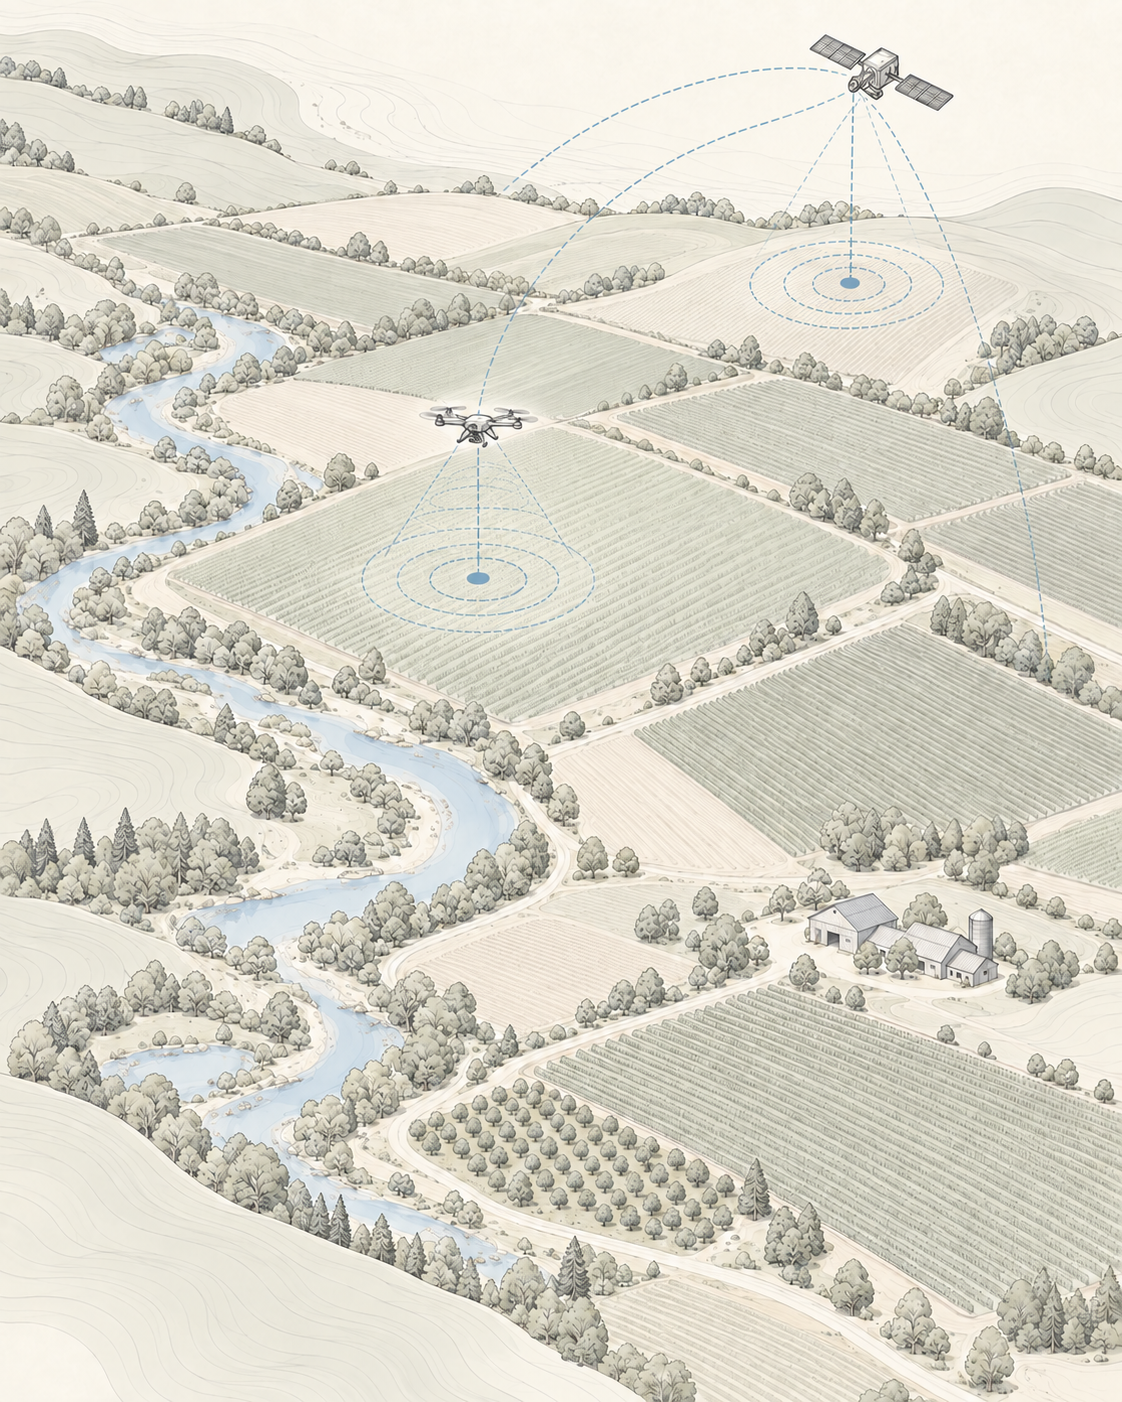
Areas of environmental interest change continuously and recurring observation is the only way to record those changes with comparability. Convex applies territorial visual perception, time series and climate context to track the evolution of conservation areas, water bodies and regions under anthropogenic pressure.
Areas of environmental interest change continuously and recurring observation is the only way to record those changes with comparability. Convex applies territorial visual perception, time series and climate context to track the evolution of monitored areas.
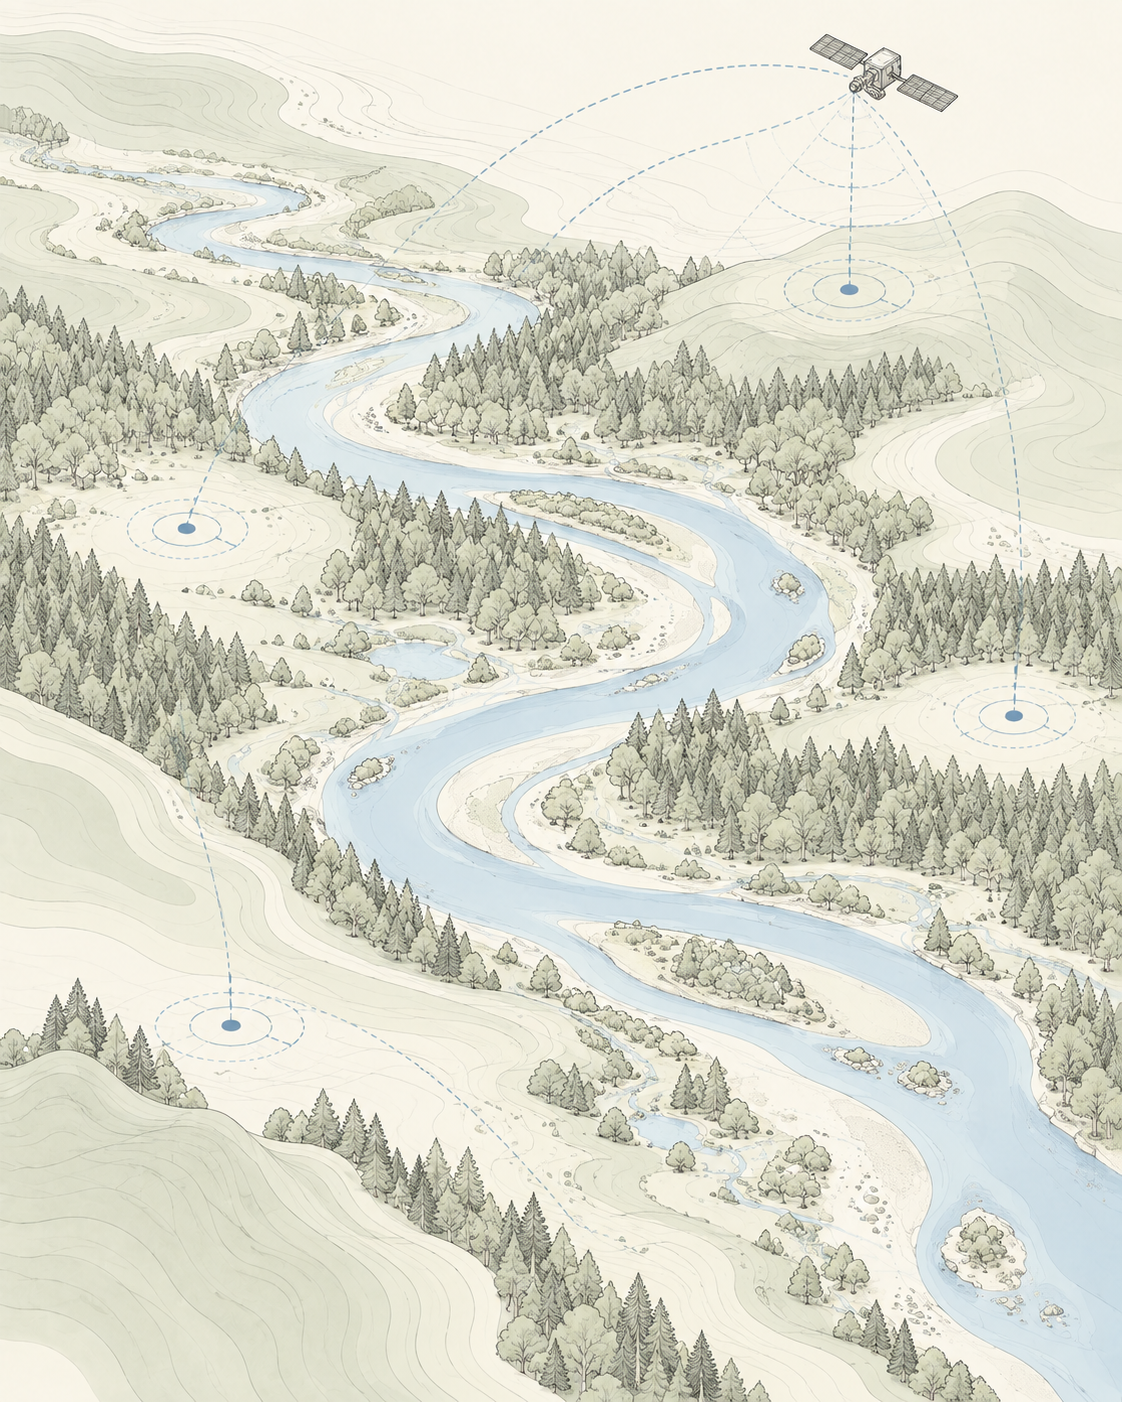
Vegetation, land use and water bodies shift over time but are rarely recorded in a comparable way.
Areas of environmental interest are extensive and on-site inspection at a useful frequency is unfeasible.
Photos and walkthroughs exist but do not form a comparable history of the same area.
Rainfall, temperature and droughts explain much of what an image shows, yet stay out of the record.
Slow alterations go unnoticed without a time series to make them visible.
/ Intelligence and computer vision for the environment
From territorial observation to change interpretation, turning data into clearer environmental decisions.
The same architecture runs across every sector. What changes is which layer is critical and which proprietary systems take part.
Visual and geospatial capture of areas of interest, clipped per polygon.
Reading of change between cycles and a written diagnosis of the observed area.
Environmental context for the period: rainfall, temperature and conditions affecting the area.
Monitoring cycle scheduling and automatic report delivery per area.
Sources compatible with the systems deployed in this sector. No layer is assumed: every monitored area declares what is actually available.
Multispectral scenes filtered by cloud cover and validity over the area.
Vegetation and water indices computed over the exact declared polygon.
GeoJSON polygons of monitored areas, server-side area calculation and per-region clipping.
Cycle-by-cycle history, so the same area can be compared across months.
Local weather series matched to the period of each observation.
Previous reports for the area, preserved as a record of what has been observed.
Each application states the problem addressed, the data used, the Convex system involved and the operational output produced.
Extent exceeds the capacity of on-site inspection.
Gradual alterations go unnoticed without temporal comparison.
Water surface and bank lines change with no comparable record.
Imagery without an explanation of what happened in the area.
Reports depend on somebody remembering to generate them.
The eligible observation over the area is identified and validated.
Indices and clips are computed over the declared polygon.
Nexa M1 compares the cycle with the history and describes the observed changes.
Regions with relevant change are highlighted for technical assessment.
The team decides on a targeted inspection or intervention on the flagged point.
The cycle is archived and becomes part of that area's time series.
Per-index and per-region clips over the area polygon.
Cycle-by-cycle evolution of the same monitored area.
Written interpretation of the cycle, produced by Nexa M1.
Highlight of relevant changes between cycles.
One PDF per cycle, delivered automatically.
Weather conditions for the observed period.
Preserved record of previous cycles.
We separate what is in operation from what is still under development. Research and prototypes are never presented as deployed product.
Recurring observation with geospatial clipping and per-cycle report. Potential application under study.
Comparative reading across cycles of the same area. Potential application under study.
Retroactive queries over previous cycles of the same area. Potential application under study.
Specific classification models for vegetation types and land use are under research.
Tracking of water surface and bank lines is under study.
Preservation units and protected areas requiring recurring tracking.
Water bodies and banks that vary over time.
Transition areas where land use changes continuously.
Vegetation cover that requires long-term tracking.