Observe
Nexa Vision
Clipping to the drawn area, acquisition of eligible Sentinel-2 scenes and per-pixel spectral index computation.
Agronomic decisions depend on observing the same area over time, in the right place. Convex turns orbital imagery, spectral indices and climate context into interpreted time series per monitored area, so within-field variability stops being invisible.
Agronomic decisions happen in short windows, over areas that are never uniform. Convex observes each monitored area on every eligible orbital pass, computes spectral indices, builds the time series and returns an operational reading with local climate context.
A field average hides zones that behave differently. Without a spatial cut, management stays uniform over ground that is not.
Field walks are occasional and expensive. Between visits, meaningful change happens with no record.
Not every satellite pass yields a usable scene. The cycle must handle the absence of a valid observation explicitly.
Isolated indices do not say what to do. The missing layer is the one that interprets the trend and writes it down.
Rainfall, temperature and water deficit explain much of what an image shows, yet usually live in a separate system.
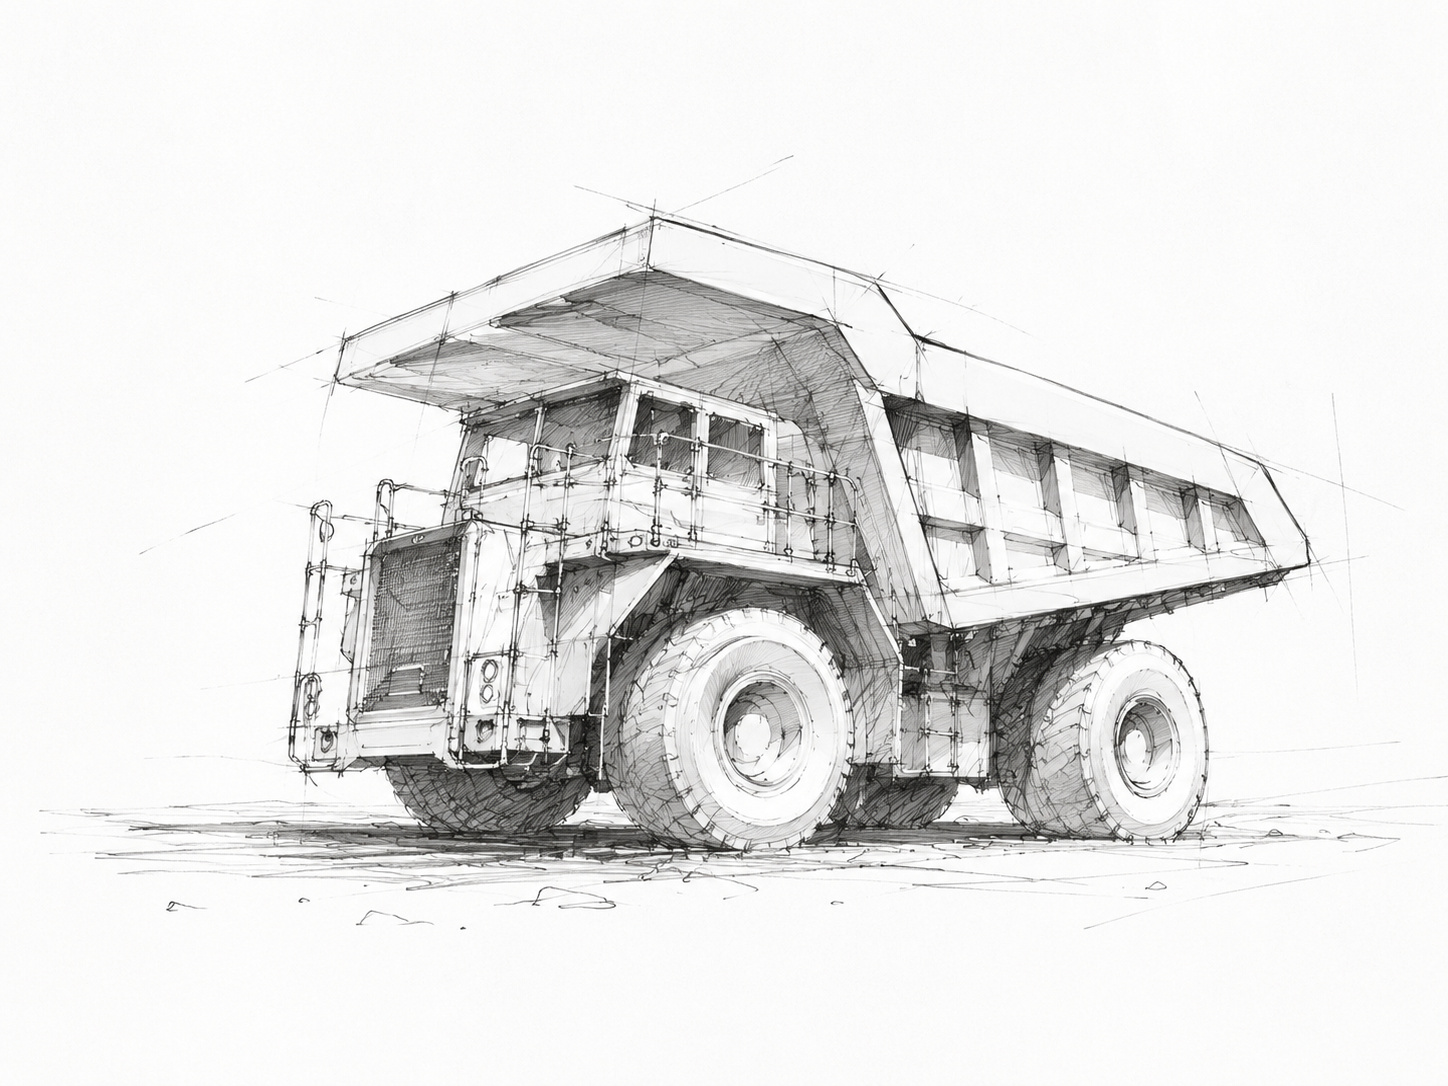
The same architecture runs across every sector. What changes is which layer is critical and which proprietary systems take part.
Clipping to the drawn area, acquisition of eligible Sentinel-2 scenes and per-pixel spectral index computation.
Reading of the time series, comparison against previous cycles and a written operational diagnosis of the area.
Local weather context folded into the reading: rainfall, temperature and operational window conditions.
Monitoring cycle scheduling, mission state and automatic report delivery per area.
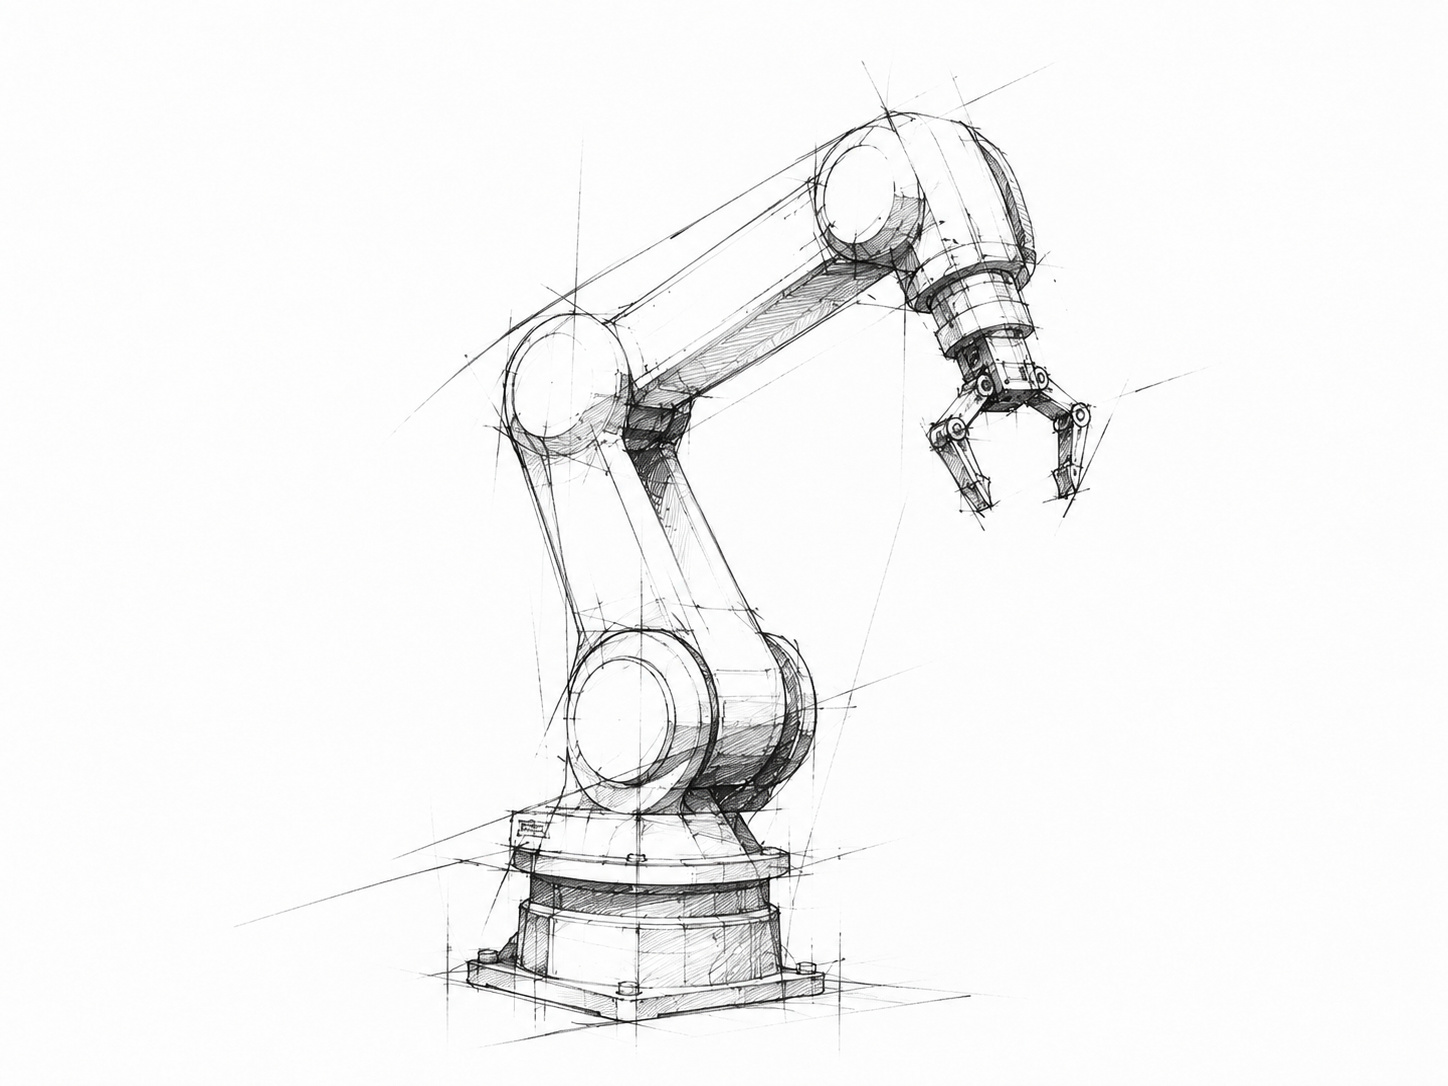
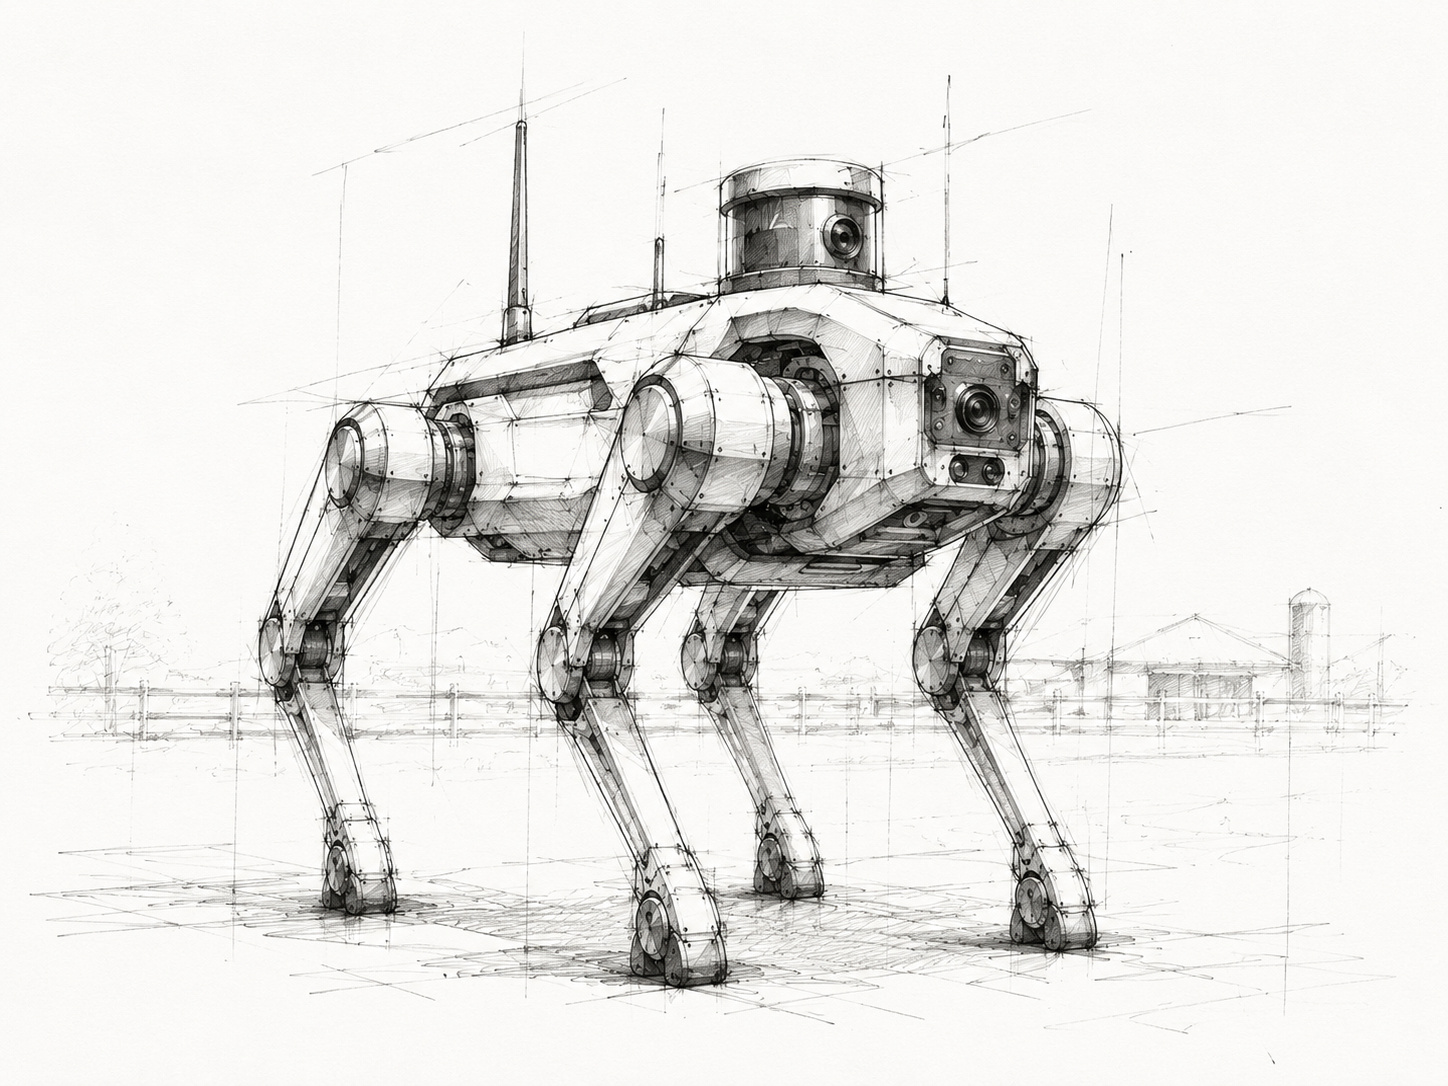
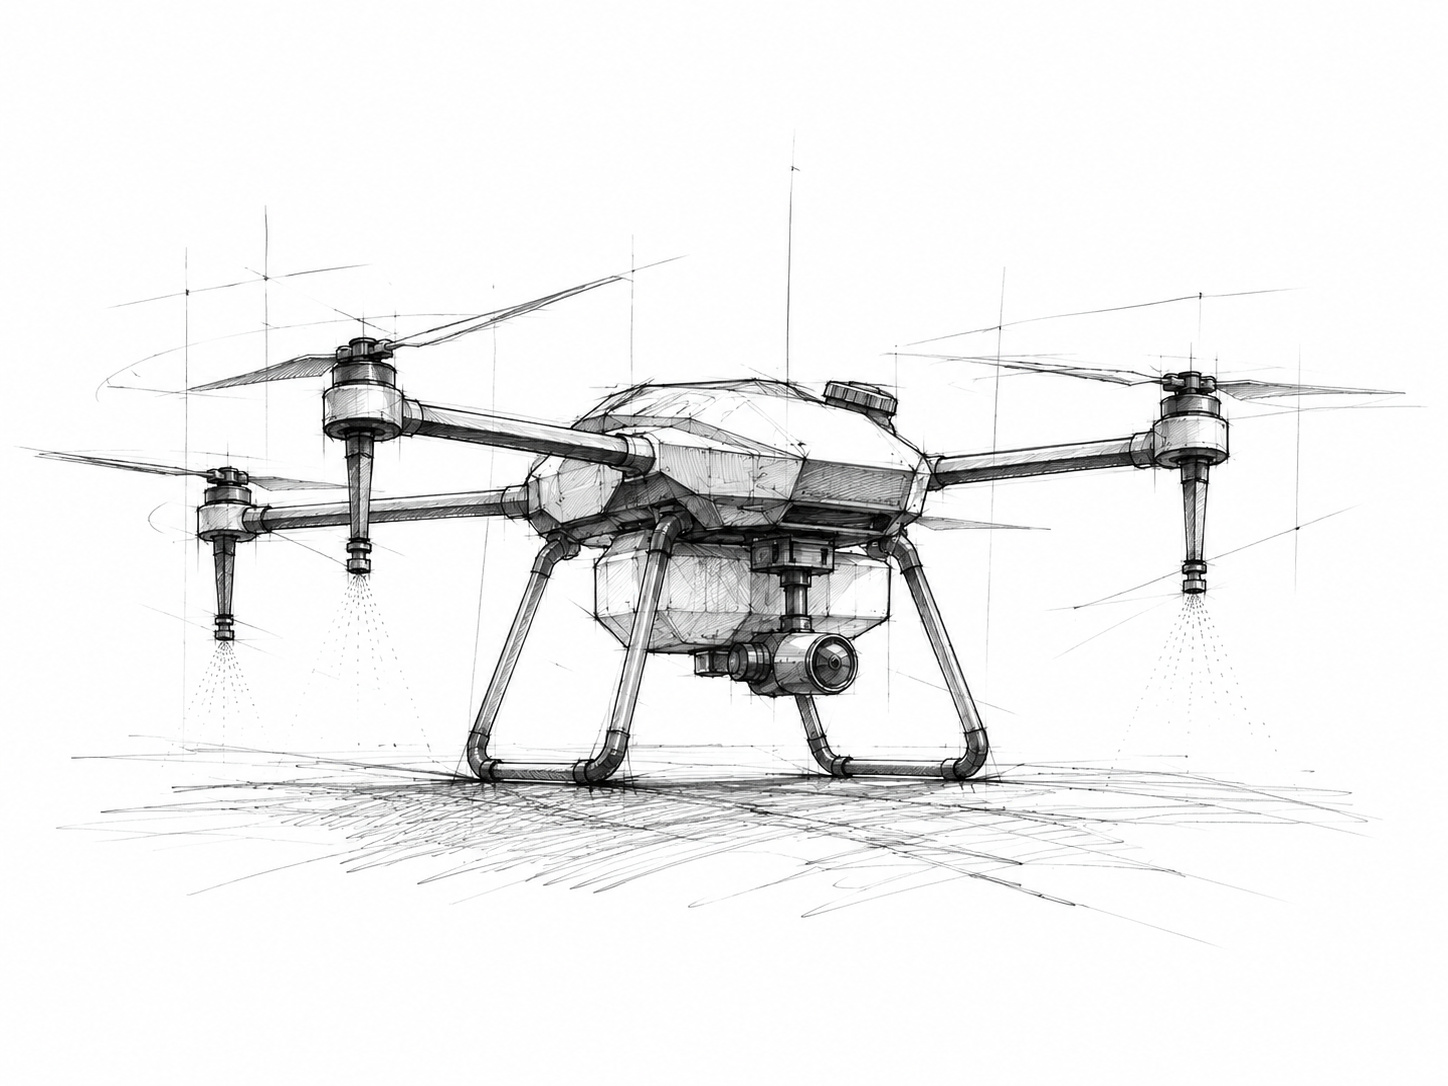
Physical execution layer in the field. In development — see technology stage.
Sources compatible with the systems deployed in this sector. No layer is assumed: every monitored area declares what is actually available.
Sentinel-2 multispectral scenes filtered by cloud cover and validity over the area.
NDVI, NDRE and derived indices computed over the exact declared polygon.
GeoJSON polygon of the monitored area, server-side area calculation and per-field clipping.
Cycle-by-cycle history, so the same area can be compared across months.
Local weather series matched to the period of each observation.
Previous reports for the area, preserved as a record of what has been observed.
Each application states the problem addressed, the data used, the Convex system involved and the operational output produced.
Uniform management over a heterogeneous field.
Observations that cannot be compared to each other.
Losses noticed too late.
Imagery without an explanation of what happened in the field.
Reports that depend on somebody remembering to generate them.
The eligible orbital pass over the area is identified and the scene is validated for cloud cover.
Spectral indices are computed over the exact polygon declared by the customer.
Nexa M1 reads the series, compares it with the area history and writes the cycle diagnosis.
Divergent zones and relevant change are highlighted for ground verification.
The agronomy team decides the intervention with the spatial cut in hand.
The cycle is archived and becomes part of that area's time series.
Per-index clips over the area polygon.
Cycle-by-cycle evolution of the same monitored area.
Written interpretation of the cycle, produced by Nexa M1.
One PDF per cycle, delivered automatically.
Weather conditions for the observed period.
Preserved record of previous cycles.
We separate what is in operation from what is still under development. Research and prototypes are never presented as deployed product.
Full cycle of acquisition, computation and report delivery.
Written diagnosis derived from the area's time series.
Retroactive queries over previous cycles of the same area.
Models flag divergent behaviour, not a phytopathological diagnosis. Validation in progress.
Robotic actuation integrated into the monitoring cycle.
Large continuous areas where spatial variability is the main target of observation.
Perennial crops, where comparing cycles matters more than any single reading.
Smaller areas and short cycles that need frequent observation.
Extensive fields with zone-based management and long tracking cycles.
Long-horizon territorial tracking of the same area.