
Nexa Vision: computer vision applied to AI.
Nexa Vision gives Convex's robots eyes. Perception, scene understanding, diagnosis and reporting — from sensor to management dashboard, in a single pipeline.
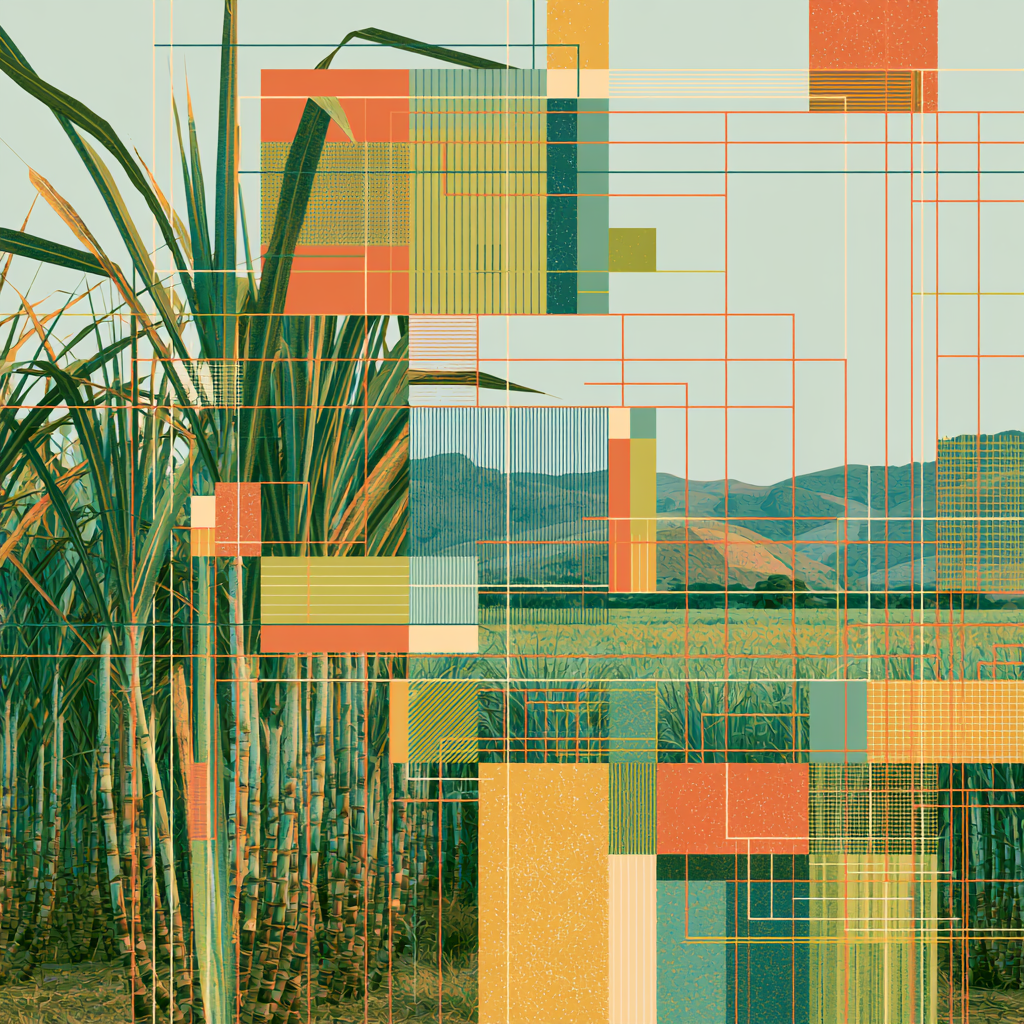
The robot's vision layer, between the pixel and the decision.
Autonomous robots are only useful when they see the world with the same care as an experienced operator. Nexa Vision combines detection, segmentation, classification and multimodal models to turn raw imagery into structured scene understanding.
This layer feeds both the navigation and actuation of Convex robots — like Axis and Synapse Control-based drones — and the diagnosis and recommendation reports delivered to the grower.
Nexa Vision's pillars
Perception
Detection, segmentation and classification of objects, surfaces and patterns in images captured by drones, mobile robots and fixed field cameras.
Scene understanding
Multimodal models understand context: field, crop, growth stage, terrain type, infrastructure condition and the presence of animals or people.
Robotic decision
Structured outputs feed the navigation, actuation and task-prioritization logic of Convex robots and third-party systems.
Diagnosis and report
Every mission generates a visual report with detections, indicators and recommendations, ready for the technical team and the manager.
How the Nexa Vision pipeline works, from capture to action
Capture
Images from drones, Axis robots, fixed cameras or the field team's smartphone.
Pre-processing
Geometric correction, mosaicking, georeferencing and sync with robot telemetry.
Inference
Computer vision and multimodal models run in the cloud or at the edge, close to the robot.
Fusion
Detections are cross-referenced with maps, history and agronomic or operational rules.
Action
The result becomes a command for the robot, an alert for the operator, or a report for the manager.
From satellite to report, one cycle per valid observation.
Every Nexa Vision report comes from a new valid Sentinel-2 optical observation. With no usable scene, no report is simulated: the cycle waits for the next eligible pass.
- 01Sentinel-2
- 02new pass
- 03quality control
- 04valid observation
- 05processing
- 06indices
- 07historical comparison
- 08Nexa M1
- 09PDF
- 10notification
Report frequency
- —Every 10 days
- —Every 15 days
- —Every 30 days
Nominal frequency of up to 5 days, subject to the availability of a new valid optical observation. Available on contracts above 100 hectares, defined through a commercial proposal.
When no usable scene is available
No suitable new optical observation was available for this cycle. Monitoring will continue automatically.
Nexa M1 included
AI interpretation included with each completed analysis, subject to a fair-use policy: each completed analysis includes an allowance of up to 1,000 Nexa M1 output tokens for interpreting that analysis.
Report language: Brazilian accounts receive the PDF in Portuguese by default and international accounts in English; a manual language preference can override that.
Multiple lenses to read vegetation and terrain.
Nexa Vision processes multispectral images and generates indices that quantify vigor, moisture, chlorophyll, surface water and degraded areas. Each index answers a specific operational question and can be combined for more robust diagnoses.
NDVI
Vegetation vigor and density. The basis for zoning and gap detection.
NDRE
Red-edge response, sensitive to chlorophyll and nitrogen at advanced growth stages.
GNDVI
Vigor computed on the green band, useful under denser canopies.
SAVI
Soil-adjusted vigor, highlighting areas where exposed soil skews the reading.
EVI
Vigor corrected for atmosphere and soil, with better response in high biomass.
NDMI
Vegetation moisture. Indicates possible canopy water stress.
NDWI
Surface water and waterlogging within the area boundaries.
NBR
Burn scars and vegetation degradation.
The entire cycle tracked index by index.
Every pass feeds time series per index. The combined reading shows the evolution of vigor, the change in area within each range, and the drop in moisture before the problem becomes visible in the field. The charts below illustrate the tracking format delivered on the dashboard and in reports.
Curva de vigor da safra
NDVI, NDRE e NDMI por data de passagem: emergência, pico vegetativo e senescência.
Distribuição de área por faixa de NDVI
Percentual da área em cada classe de vigor a cada passagem — mostra o fechamento do dossel.
Estresse hídrico acumulado
Evolução do NDMI: queda sustentada indica déficit hídrico antes de aparecer no vigor.
Composição atual da área
Última passagem processada: participação de cada faixa de vigor no total da área.
From drone to ground robot, in the same pipeline.
Nexa Vision integrates natively with Synapse Control and Axis, and also consumes images from third-party cameras, satellites and the technical team's mobile devices.
Inference where it makes sense for the operation.
Models run in the cloud for heavy analysis and at the edge, embedded in the robot, when response time matters for field navigation and actuation.
Nexa Vision applications in aerial and ground robotics
Aerial robotics
- —Autonomous inspection of fields and pastures with drones.
- —Obstacle and risk-area detection during the mission.
- —Herd counting and monitoring from the air.
- —Assessment of spray application and vegetative cover.
Ground robotics
- —Vision-assisted navigation along planting rows.
- —Pest identification and plant-level stand failure detection.
- —Infrastructure recognition: fences, water troughs, gates.
- —Targeted application and vision-guided sampling.
Computer vision for real operations.
The same vision and spectral-analysis technology adapts to different industries. Below, examples of how Nexa Vision is applied in each context.
Agriculture
Nexa Vision turns drone, satellite and field-camera imagery into precise agronomic diagnosis. Spectral indices detect water stress, nutritional deficiencies, pests, weeds, planting failures and yield variation within the field. The platform generates prescription maps for targeted application and tracks the crop's evolution across the cycle.
Livestock
Visual monitoring of the herd and pasture with drones and fixed cameras. Nexa Vision counts animals, estimates weight, identifies behavior patterns, detects welfare signals and maps forage availability and quality. Thermal imagery complements nighttime or low-visibility tracking.
Mining
Autonomous inspection of ore stockpiles, tailings dams, slopes, conveyor belts and infrastructure. Computer vision estimates volumes, identifies displacement, cracks, erosion and safety deviations, reducing human exposure and increasing inspection frequency in hard-to-reach areas.
Construction
Progress tracking, structural inspection, earthworks control and materials management. Nexa Vision compares site imagery with digital models and schedules to identify delays, inconsistencies and risks, and also monitors PPE use and the movement of people and machinery.
Infrastructure and Security
Autonomous patrolling, perimeter inspection and continuous monitoring of critical assets. Drones and ground robots capture images of fences, towers, lines, roads and facilities, while AI detects intrusions, damage, corrosion signs or obstructions and generates real-time alerts.
Logistics and Operations
Visual counting and tracking of loads, pallets, vehicles and equipment. Nexa Vision reads plates, identifies volumes, verifies positioning and integrates the data with management systems to speed up inventories, audits and yard control.
Other Convex Robótica products
Nexa M1
Our AI and assistant, built for robotics.
Niros
Follow areas, maps, weather, reports, alerts, Nexa Vision and Nexa M1 from your phone.
Synapse Control
Our ground control station for planning drone and autonomous robot missions.
Axis
Our robot for process automation in agriculture and livestock.
Atmos
Our portable weather station, connected to Nexa M1 over the internet.